Veksttyper på jordbruksareal fra satellitt (JordbrukSat)
JordbrukSat er et nasjonalt vektorkart som viser den geografiske fordelingen av ulike veksttyper
på jordbruksareal, samt jordbruksareal som er nedbygd. Kartet viser jordbruksareal i seks klasser og framstilles fra satellittbilder og offentlig kartdata ved bruk av maskinlæring.
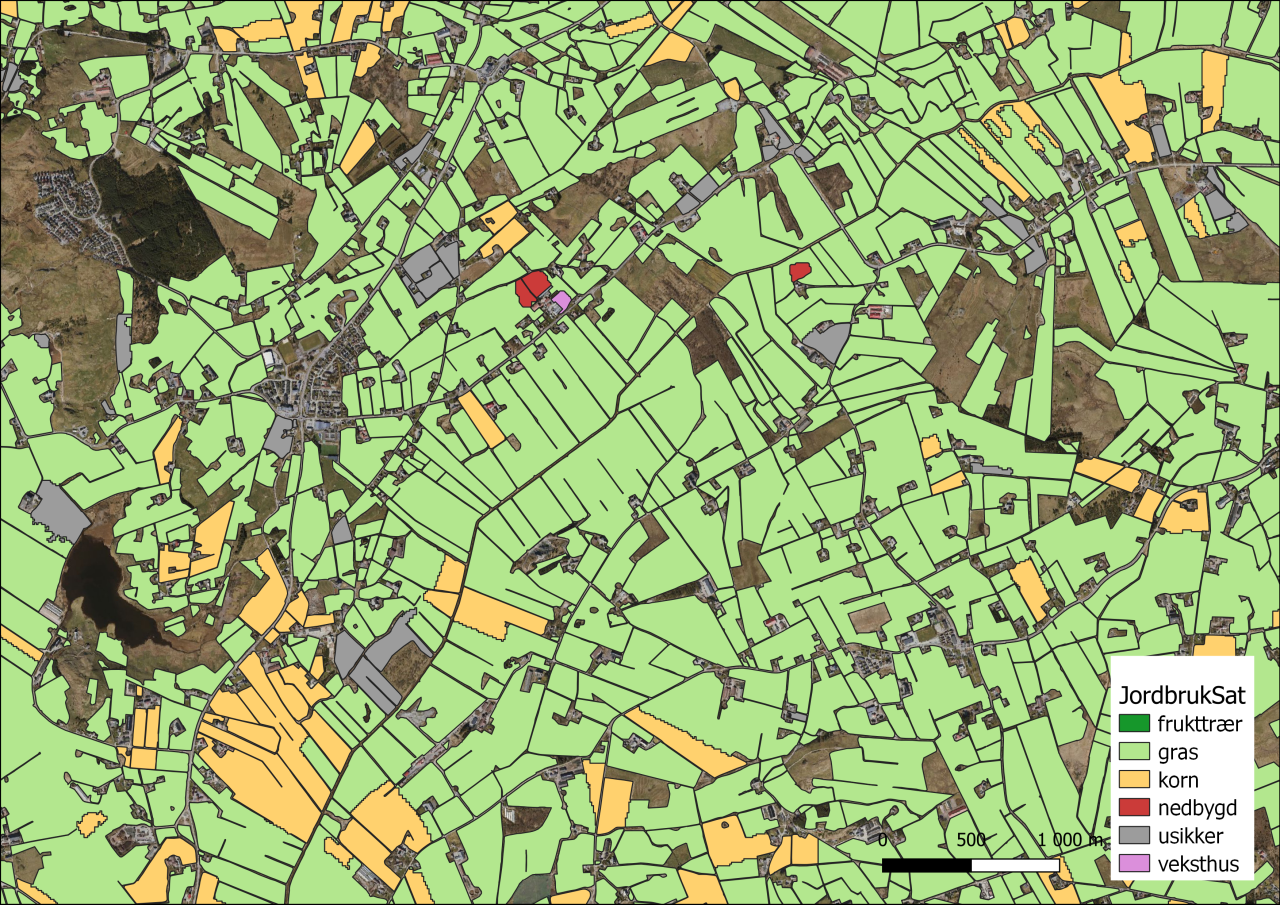
Et lite utsnitt fra JordbrukSat 2021 over et område på Vestlandet som er dominert av grasproduksjon, men det har også arealer med kornproduksjon. Noen arealer har fått klassen Usikker og slike arealer er typisk brukt til beite for hest, grønnsaksproduksjon eller ikke i drift.Foto:
Kartet som ligger ute på Kilden viser fulldyrka jord delt inn i seks klasser ved slutten av vekstsesongen 2021. Veksttyper (produksjoner) er delt i tre klasser; nedbygd areal i to klasser; mens én klasse dekker areal med usikker tolkning.
Deteksjonen er basert på automatisk tolking av satellittbilder fra Sentinel-2 satellitten i det europeiske Copernicus-programmet. Satellitten gjør opptak over et område hver 5. dag, og det gjør det mulig å følge utviklingen på et areal gjennom vekstsesongen. Klassene har ulik temporær signatur: en eng slås flere ganger i sesongen, korn modnes sent og slås kun én gang, mens andre veksttyper har en temporær signatur som avviker fra de to andre kategoriene.
Klasseinndeling
Nr.
Klasse
Forklaring
1
Korn
Kornproduksjon
2
Gras
Grasproduksjon (fôr)
3
Nedbygd
Bygninger og veiarealer
4
Veksthus
Produksjon av planter
5
Frukttrær
Plantasjer med frukttrær
6
Usikker
Arealer med usikker prediksjon
Dokumentasjon
JordbrukSat er dokumentert gjennom en NIBIO POP. Der står det mer utfyllende om bakgrunn, metode og klasseinndelingen. I tillegg er det publisert vitenskapelig om maskinlæringsmodellene som er utviklet.
Parts of the limited agricultural land area in Norway are taken up by buildings, roads, and other permanent changes every year. A method that detects such changes immediately after they have taken place is required in order to monitor the agricultural areas closely. To that end, Sentinel-2 satellite image time series (SITS) acquired during the summer of 2019 were used to detect the agricultural areas taken up by permanent changes such as buildings and roads. A deep-learning algorithm using 1D convolutional neural network (CNN), with the convolution in the temporal dimension, was applied to the SITS data. The training data was collected from the building footprints dataset filtered using a mono-temporal image aided with the areal resource map (AR5). The deep-learning model was trained and evaluated before being used for prediction in two regions of Norway. Procedures to reduce overfitting of the model to the training data were also implemented. The trained model showed a high level of accuracy and robustness when evaluated based on a test dataset kept out of the training process. The trained model was then used to predict new built-up areas in agricultural fields in two Sentinel-2 tiles. The prediction was able to detect areas taken by new buildings, roads, parking areas and other similar changes. The prediction was then evaluated with respect to the existing building footprints after a few post-processing procedures. A high percentage of the buildings were detected by the method, except for small buildings. The details of the methods and the results obtained, together with brief discussion, are presented in this paper.