Johannes Schumacher
Forsker
(+47) 407 23 321
johannes.schumacher@nibio.no
Sted
Ås - Bygg H8
Besøksadresse
Høgskoleveien 8, 1433 Ås
Forfattere
Giovanni D’Amico Davide Botticelli Giacomo Marcelli Walter Mattioli Gherardo Chirici Elia Vangi Costanza Borghi Piermaria Corona Johannes Schumacher Johannes Breidenbach Yang Su Lauri Mehtätalo Saverio FranciniSammendrag
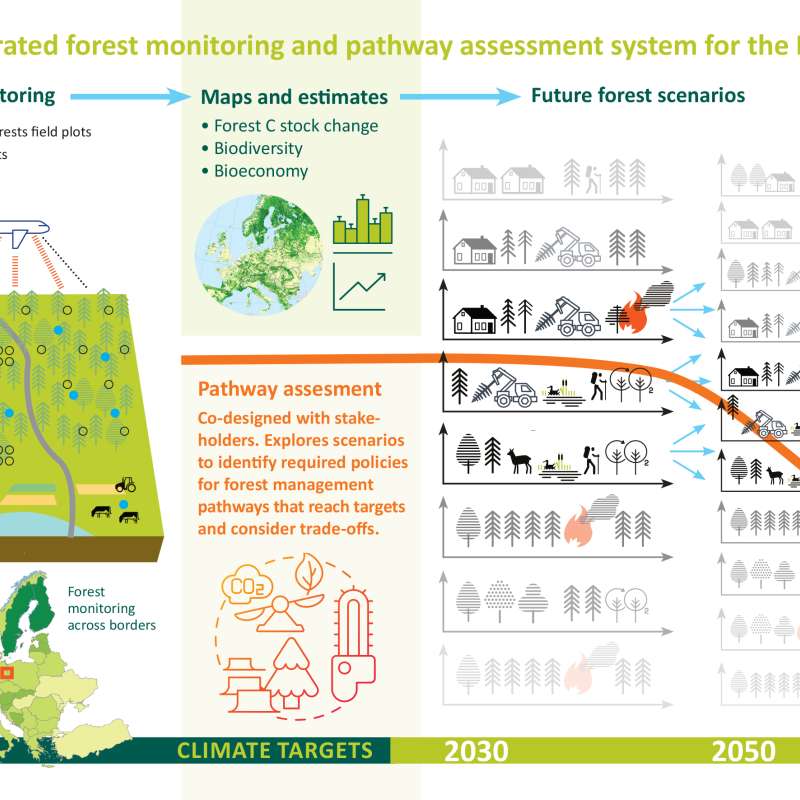
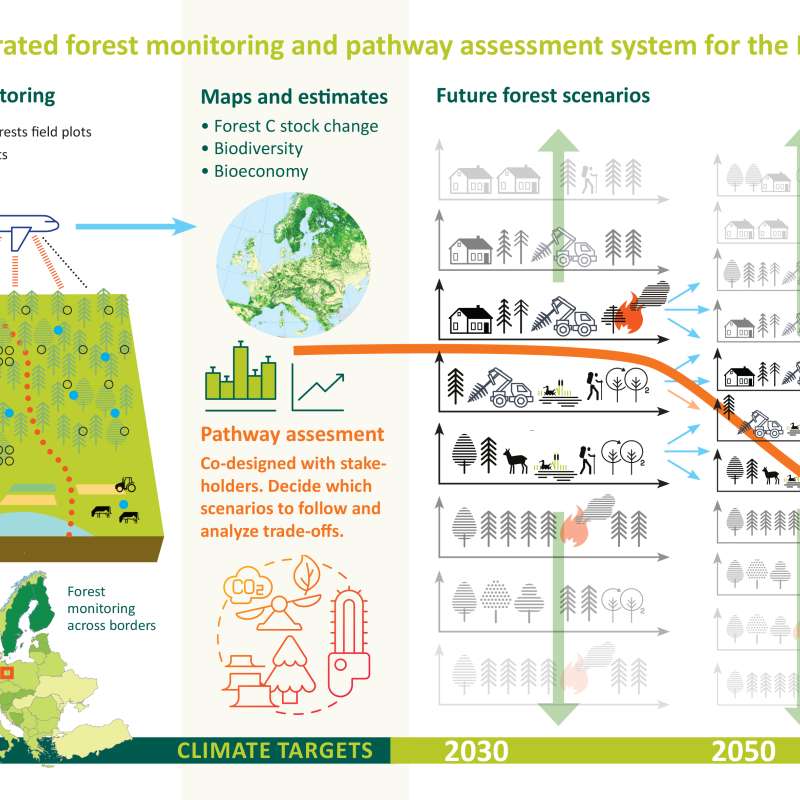
This data article presents a multi-source dataset of satellite-based auxiliary data designed for forest modelling and monitoring. The dataset integrates annual medoid composites derived from Sentinel-1, Sentinel-2, and Landsat imagery, together with spectral indices, Landsat-based 3I3D change metrics, forest mask and forest type layers, and terrain variables derived from the Copernicus GLO-30 DEM, offering comprehensive information on forest cover, spectral behavior, and change metrics. It provides harmonized predictors across seven European countries, ensuring consistency, scalability, and ease of use for researchers developing or validating models to understand forest dynamics and estimate forest-related variables such as biomass or canopy recovery. A curated subset of the dataset is distributed via Zenodo, along with direct public access links to the complete multi-terabyte archive. The data support applications in forest biodiversity conservation, carbon monitoring, biomass modelling, and climate-change impact assessment.
Sammendrag
Det er ikke registrert sammendrag
Forfattere
Johannes Schumacher Håvard Toft Larsen Paul McLean Marius Hauglin Rasmus Astrup Johannes BreidenbachSammendrag
The number of people affected by snow avalanches during recreational activities has increased over the recent years. An instrument to reduce these numbers are improved terrain classification systems. One such system is the Avalanche Terrain Exposure Scale (ATES). Forests can provide some protection from avalanches, and information on forest attributes can be incorporated into avalanche hazard models such as the automated ATES model (AutoATES). The objectives of this study were to (i) map forest stem density and canopy-cover based on National Forest Inventory and remote sensing data and, (ii) use these forest attributes as input to the AutoATES model. We predicted stem density and directly calculated canopy-cover in a 20 Mha study area in Norway. The forest attributes were mapped for 16 m × 16 m pixels, which were used as input for the AutoATES model. The uncertainties of the stem number and canopy-cover maps were 30% and 31%, respectively. The overall classification accuracy of 52 ski-touring routes in Western Norway with a total length of 282 km increased from 55% in the model without forest information to 67% when utilizing canopy cover. The F1 score for the three predicted ATES classes improved by 31%, 9%, and 6%.