Five mapping tools for climate- and nature-friendly land-use planning in Norway
Norway is known for its beautiful nature—fjords and mountains, forests and plateaus. Good mapping tools are essential for sound management that takes both climate and nature into account. Photo: Hege Ulfeng
Norwegian local administrations have long asked for easy‑to‑use map tools that show how land use and development affect climate and nature. To meet this need, NIBIO and several partners have developed five tools that make it easier to understand what we have—and what we may lose.
Two important white papers were adopted by the Norwegian Parliament in 2025: the Nature White Paper and the Climate White Paper. Both emphasize the importance of detailed spatial data for achieving national climate and environmental targets. Municipalities and counties must also maintain a clear overview of land-use changes by introducing so-called land-use accounts. Requirements for climate and environmental considerations in spatial planning are becoming increasingly strict.
At the same time, many municipalities have struggled to gain an overview of the consequences of land development. One reason is that key datasets have been scattered and difficult to access. This is the reason why NIBIO, in cooperation with other government agencies, are developing new nationwide tools for land analysis, built-up areas, greenhouse gas emissions, and natural forest.
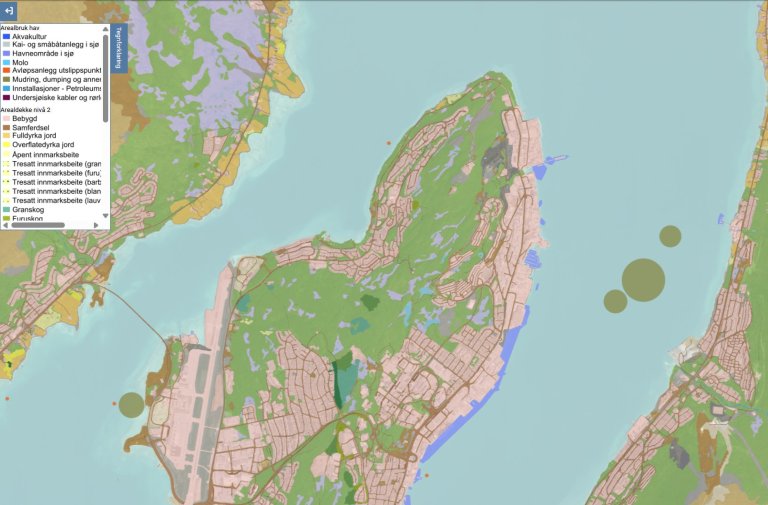
National Base Map for Land Analysis – A Shared Knowledge Base for the Entire Country
The National Base Map for Land Analysis compiles the most important public datasets on land information in Norway. The map also includes an ecosystem classification. It is based on data from the Public Map Data framework (DOK) and combines these into a single shared dataset. The first annual version for 2025 has now been launched as WMS (Web map service) on Geonorge, providing a comprehensive overview of land areas in both urban and rural settings. GeoNorge is Norway’s national portal for maps and geographic data, where public agencies share and provide access to official geospatial information.
The map was developed through collaboration between NIBIO, the Norwegian Mapping Authority, the Norwegian Environment Agency, and Statistics Norway, with extensive user participation. It provides municipalities, counties, and government agencies with a common knowledge base for land analysis and land-use accounting. This knowledge can be linked to spatial plans and used to assess the consequences of new development for both nature and climate.
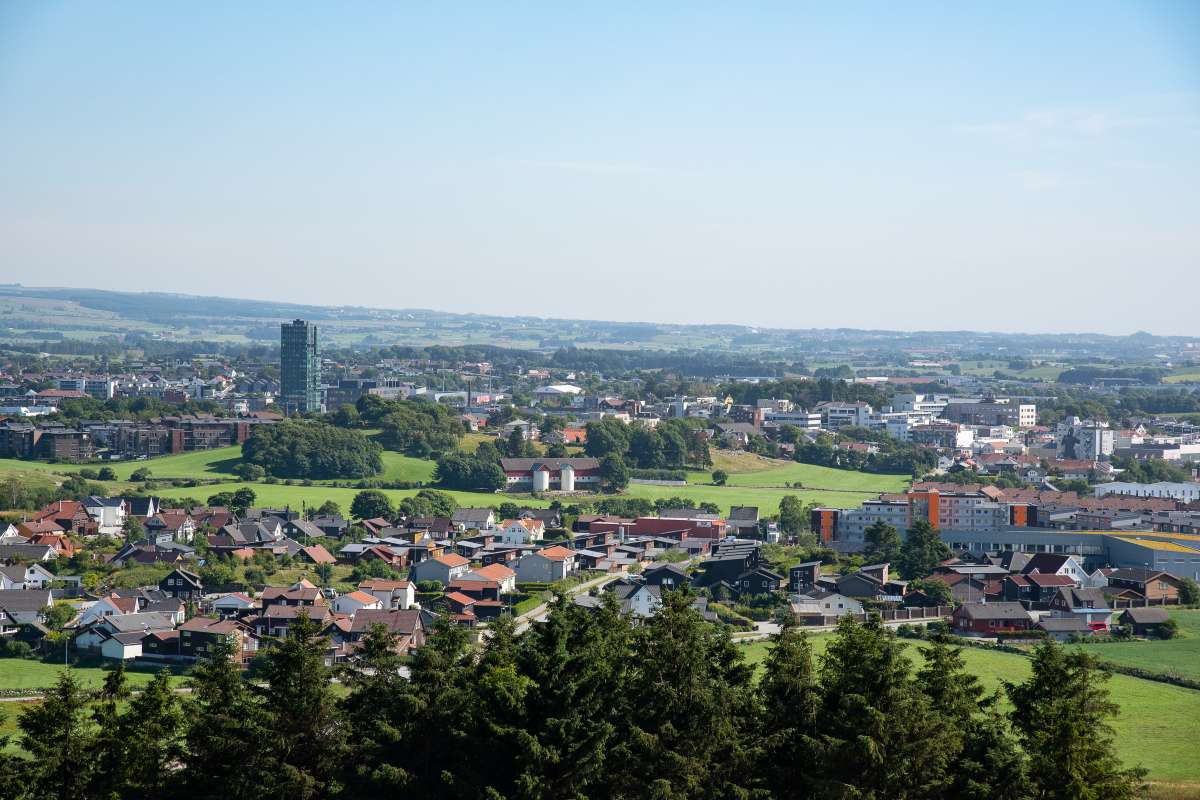
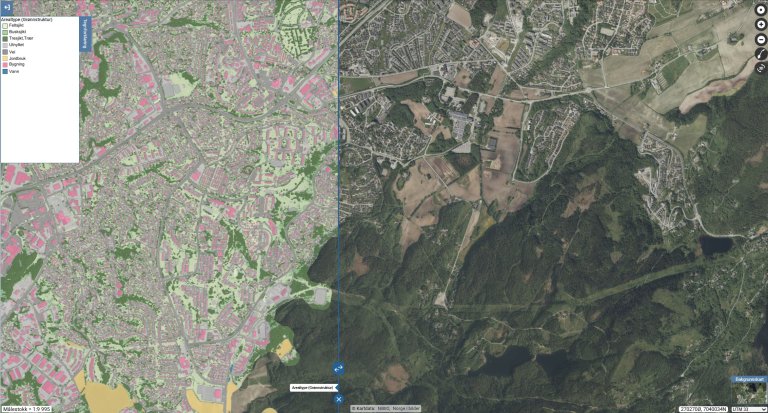
FKB Green Structure – Detailed Overview of Green Areas in Built-Up Zones
FKB Green Structure is a new national map showing green areas within built-up environments. Vegetation is divided into ground layer, shrub layer, and tree layer according to height. The map is created by combining high-resolution satellite imagery, a national detailed elevation model, and detailed FKB data for roads, buildings, and water. FKB stands for the Common Map Database, a collection of some of Norway’s most detailed spatial datasets.
The service provides municipalities and other stakeholders with a standardized, nationwide basis for management of green infrastructure in towns and cities. Green infrastructure is also linked to stormwater management, blue-green factors, and climate- and nature-based measures in urban development. FKB Green Structure is available via Geonorge as a WMS service and for download, contributing to both climate adaptation and improved nature management in urban areas across the country.
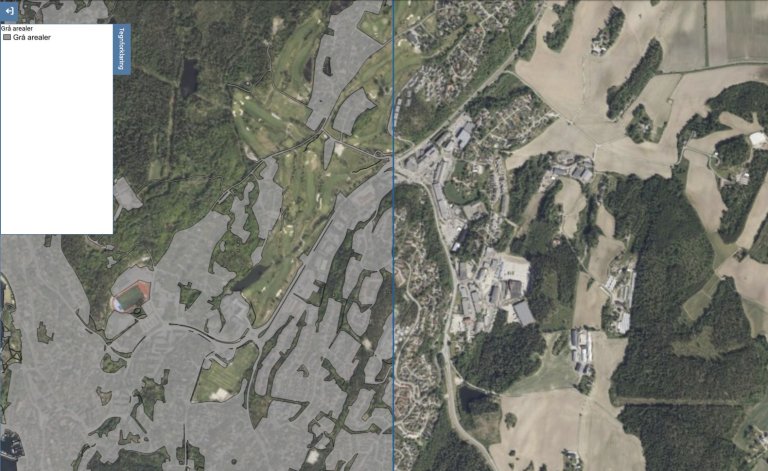
Map of Built-up Areas – Build More Where Development Already Exists
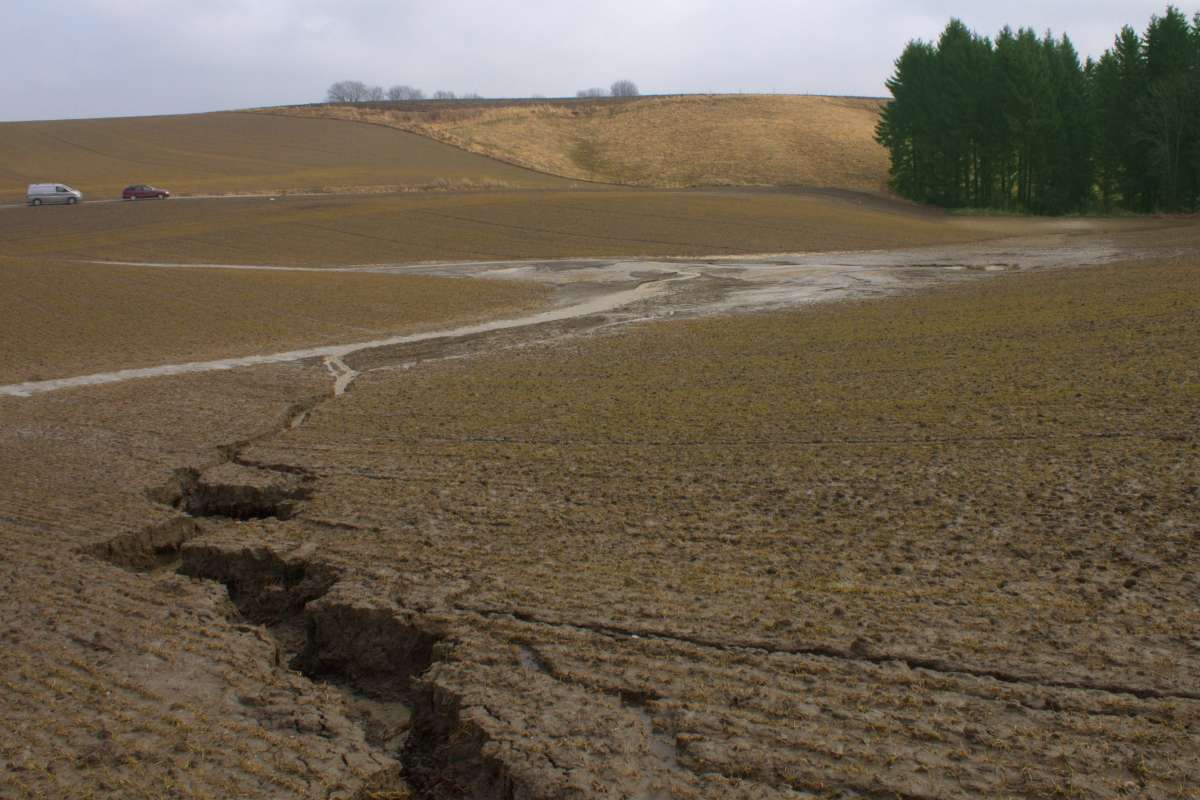
The map of built-up areas is a nationwide service showing where land in Norway is already heavily affected by human activity—from residential areas and commercial zones to roads, parking areas, and other sealed surfaces. The map also provides information on how much of an area is built-up, covered by buildings or vegetated.
The map was commissioned by the Norwegian Environment Agency and developed by NIBIO, the Norwegian Mapping Authority, and Statistics Norway. It is based on the National Base Map for Land Analysis, FKB Green Structure, and additional data on buildings from Statistics Norway. The aim is to make it easier to plan new development within already developed areas, thereby reducing pressure on natural and agricultural land. The map can also be used in natural capital accounting and climate work at municipal and national levels.
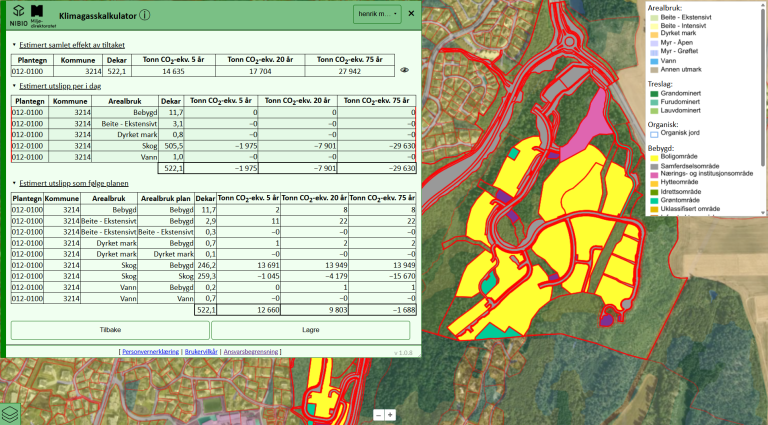
Map-Based Greenhouse Gas Calculator – Calculates Emissions from Land-Use Change
The new map-based greenhouse gas calculator enables municipalities and other stakeholders to calculate emission and sequestration effects from current land use and planned land-use changes. Users can draw a target area directly in the map or upload municipal master plans and zoning plans. They will then receive calculated emissions of CO₂, methane, and nitrous oxide expressed in tonnes of CO₂ equivalents per hectare over time horizons of 5, 20, and 70 years.
The calculator was developed by NIBIO in cooperation with the Norwegian Environment Agency. It follows methodologies from the IPCC and Norway’s national greenhouse gas inventory. The tool is intended for use in municipal and regional spatial planning and will also form part of guidance for national planning guidelines and the Environment Agency’s handbook for climate and environmental impact assessment. This makes it easier to visualize the climate consequences of development plans and safeguard carbon-rich natural areas such as forests and wetlands.
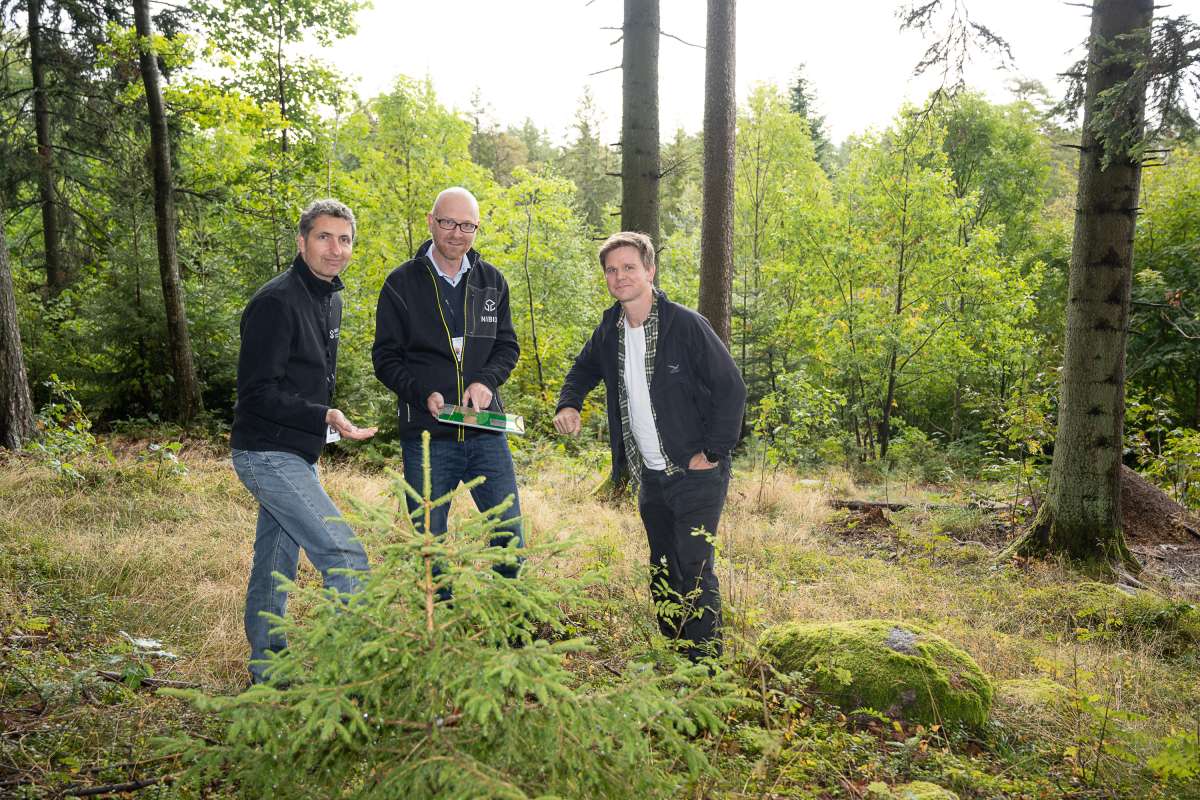
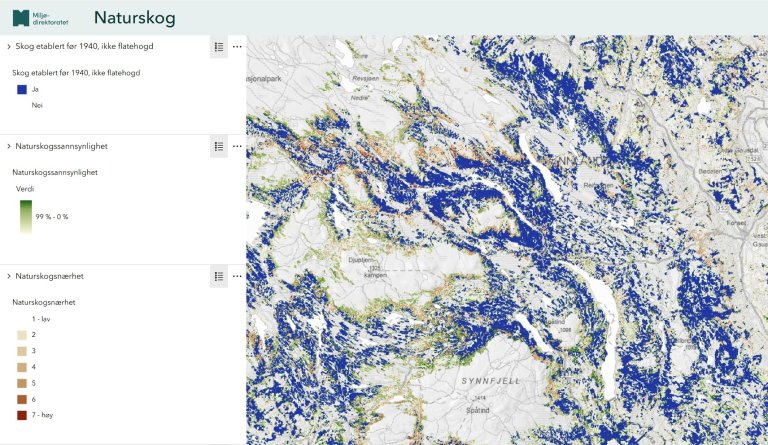
Natural Forest Map – First Nationwide Overview of Near-Natural Forest Areas
The Natural Forest Map is the first map to provide nationwide coverage of forests that have not been clear-cut since before 1940. This offers an indication of which areas retain strong characteristics of natural forest. Commissioned by the Norwegian Environment Agency and the Norwegian Agriculture Agency, NIBIO—together with NMBU, NINA, and the Natural History Museum at the University of Oslo—has produced three maps: one showing forest established before 1940, one indicating the probability of a forest being minimally affected, and one grading how close the forest is to natural forest conditions.
The map was created using satellite imagery, laser scanning, and machine-learning methods combined with data from the National Forest Inventory. The result is a detailed map that can be used in assessments of biodiversity, forest condition, and conservation needs. This is a first version that will be further developed, but it can already help municipalities and authorities avoid development in the most valuable natural forest areas.
A Shared Effort for Better Land Knowledge
All five tools give municipalities, counties, and authorities better insight into land resources, how they are used, and the consequences new interventions may have for both climate and nature. The National Base Map for Land Analysis, FKB Green Structure, theBuilt-up Areas map, the greenhouse gas calculator, and the Natural Forest Map are all first versions to be further developed in dialogue with users—but they already provide a far better starting point for achieving the new climate and nature targets adopted by Parliament.
Contacts

Ingvild Nystuen
Head of Department
-
Division of Survey and Statistics
(+47) 902 49 768 ingvild.nystuen@nibio.no Office Location: Ås O43
Other Useful Maps and Tools from NIBIO
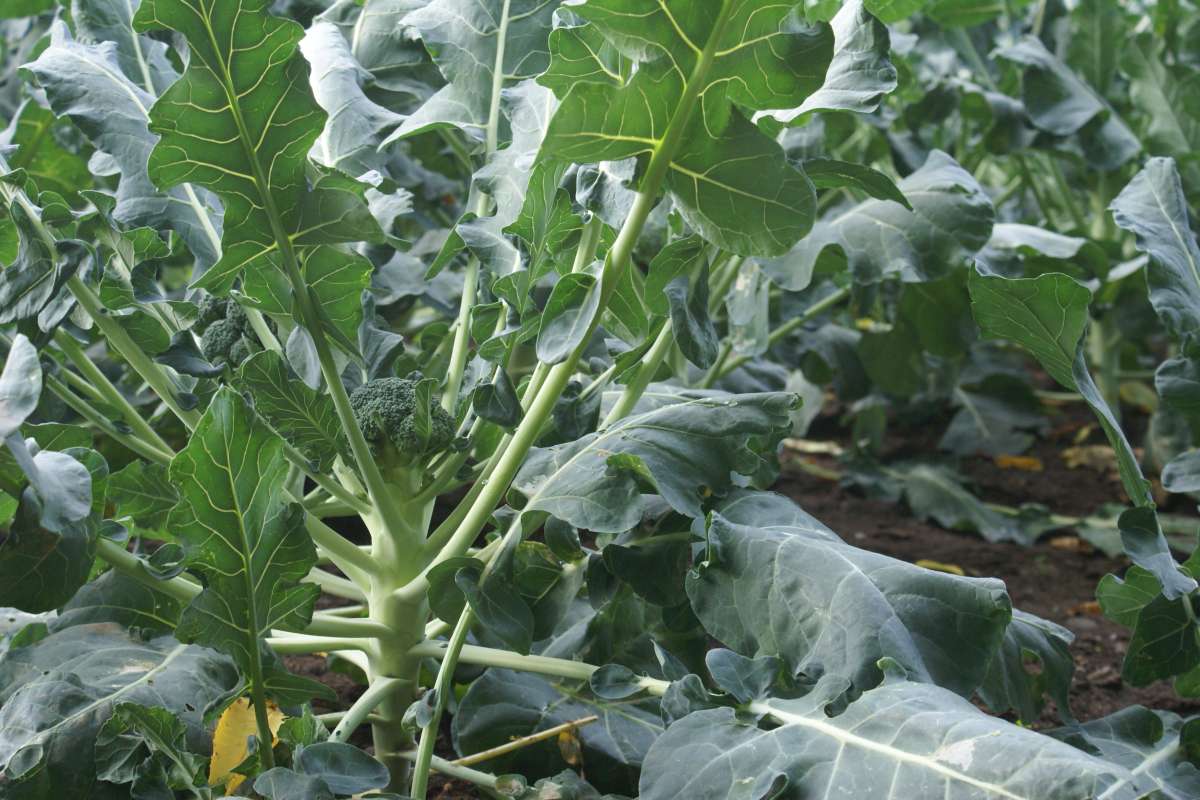
Soil maps: NIBIO is responsible for the national soil-mapping program. These maps show soil quality, cultivation potential, and many other important themes. They cover about 60% of fully cultivated and surface-cultivated agricultural land and form an important knowledge base for both management and industry. Around 10 000 hectares are mapped each year.
Vegetation maps: These maps show vegetation types and grazing quality in outfield areas in selected locations. Where available, they are an important basis for assessing, for example, cabin development or energy development against environmental values in uncultivated land.
Climate maps: Several municipalities have commissioned so-called climate maps from NIBIO. These are packages of thematic maps for early planning stages, showing greenhouse gas emissions from current land use and land conversion, flood-risk accumulation during heavy rainfall, key biodiversity areas, important temperature-regulating areas in urban zones, and more.
Some Uses of the New Tools
- Municipal master planning and zoning
- Regional planning
- Area prioritization and plan review
- Nature restoration
- Urban and town development
- Thematic planning
- Reporting and land accounting
- Impact assessment
Contacts
Ingvild Nystuen
Head of Department
-
Division of Survey and Statistics
(+47) 902 49 768 ingvild.nystuen@nibio.no Office Location: Ås O43