Svein Solberg
Research Professor
Abstract
Formålet med denne rapporten var å bruke matematiske modeller for å simulere utvikling i skog med alternative skogbehandlinger og sammenlikne dem med hensyn på omfang av vindskader. Vi spesifiserte fire alternativer som verdiorientert og stabilitetsorientert rotasjonsskogbruk, bledningsskogbruk og skjøtselsbelter langs kraftlinjer. Vi kjørte simuleringen på et 30 km2 område sør for Kongsvinger. Vi brukte modellene Heureka for å simulere bestandsutvikling i 5-årsperioder over 100-år, ForestGales for å beregne kritisk vindstyrke og beregnet volum vindskade ved å kombinere dette med frekvensfordeling for vindstyrke i området. Simuleringene gav en tydelig rangering av skogbehandlingsalternativene. Bledning gav 4,5 ganger mer skadevolum enn verdiorientert skogbehandling som igjen gav tre ganger mer enn stabilitetsorientert. Langs kraftlinjene ble vindskader omtrent eliminert ved å ha skjøtselsbelter med ekstra lav utgangstetthet og sluttavvirkning ved 18 m høyde. Ved å også se på volumproduksjon i sammenlikningene ble rangeringen lite endret. Bledning gav lavest volumproduksjon og verdiorientert skogbehandling gav kun 4% høyere produksjon enn en stabilitetsorientert. Vi konkluderer med at bledning fører til mer vindskader enn rotasjonsskogbruk, og at vi i rotasjonsskogbruk kan redusere skadeomfanget med lav utgangstetthet, ingen tynning og kort omløpstid. Langs kraftledninger kan vindskader nesten elimineres ved å gå enda lenger i samme retning.
Abstract
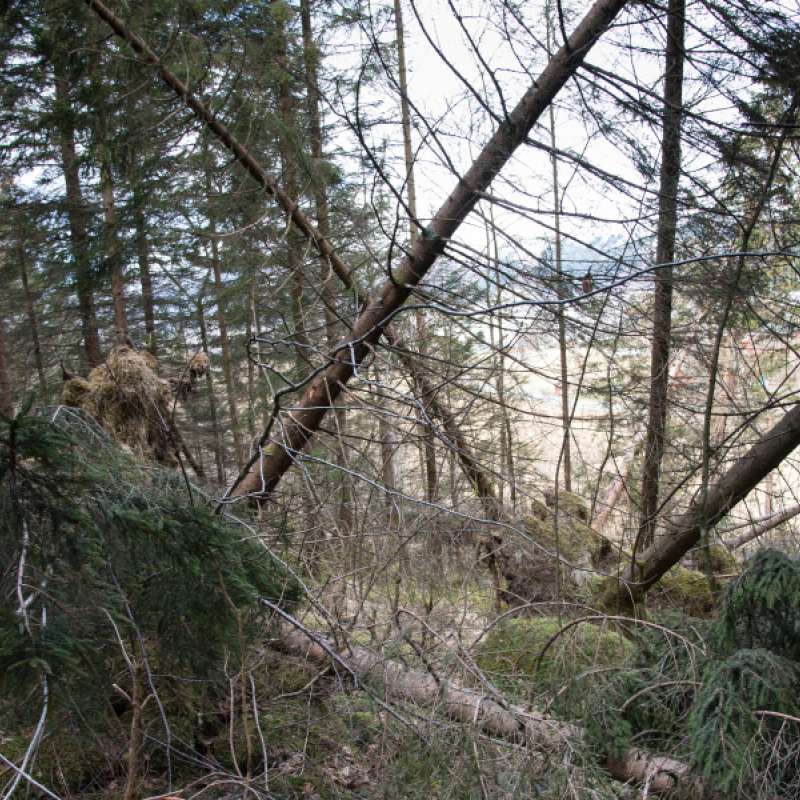
Tree falls along linear infrastructures and in particular powerlines pose a significant economic, safety and environmental challenge for the companies and institutions managing these infrastructures. The quick progression and affordability of remote sensing technologies such as drone-based inventories offers the opportunity to quickly and efficiently map individual trees along these infrastructures, enabling precise vegetation management to reduce risks. Here, we show how the hybrid empirical and mechanistic wind risk model ForestGALES can be applied to assess the vulnerability of individual trees to windfalls along selected powerlines in southern Norway. The validation dataset contained 180 recorded individual tree falls along powerlines from the winter 2020–2021. There was no major wind event recorded that winter. However, still, the ForestGALES model performed adequately, with an AUC (area under the curve) of 0.67. Combining the vulnerability index from ForestGALES with all other available tree and environmental variables in a machine learning model (extreme gradient boost algorithm) did however significantly improve the prediction performance. These results highlight how a combination of high-quality remote sensing data at the individual tree level can be utilized with ForestGALES and machine learning to provide managers with high-resolution vulnerability information for vegetation management.
Abstract
Climate change is expected to increase the frequency and severity of natural disturbances. In Nordic conifer forests, damage caused by snow accumulation in the canopy is one of the most significant disturbance agents. This study investigates whether adaptive forest management can enhance resistance to snow damage, using a large forest property in southeastern Norway as a case study. To achieve this, we extended the existing scenario analysis tool, GAYA 2.0, integrating new functionality to analyze the risk of snow damage. We performed scenario simulations using a mechanistic critical snow load model to compare two alternative management strategies: standard management and an adapted management approach that reduces stand density in regeneration and tending phases. We analyzed and compared the management effects on snow damage resistance and probability, and on long-term forest production and income. The results indicate that reduced density management leads to a 2.02 % increase in critical snow load (from 74.19 Kg m-2 to 75.68 Kg m-2), and a 10.42 % reduction in yearly damage probability (from 0.345 % to 0.308 %). These findings suggest that adaptive management practices by reducing stand density can effectively enhance resistance and mitigate risks associated with snow damage in Nordic boreal forest ecosystems. The reduced stand density management does not have a significant impact on long-term production and income levels.