Trap catches
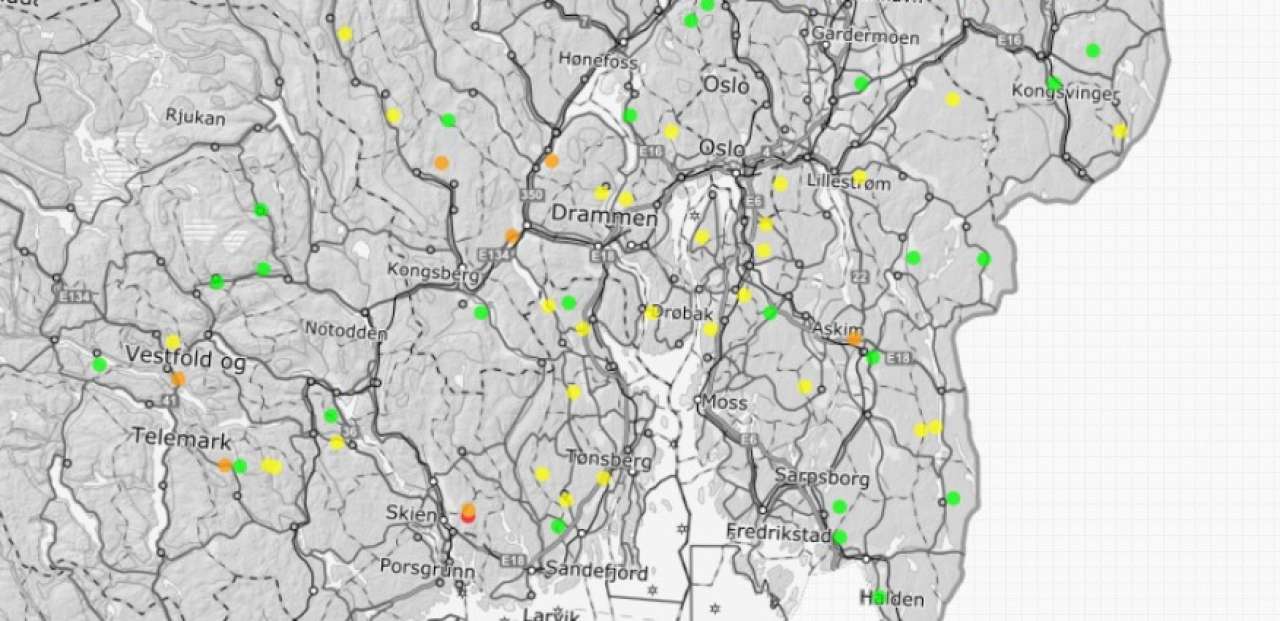
The maps under “Fellefangst” (Trap catches) show the number of Ips typographus individuals collected during this year’s season of the bark beetle monitoring program. Each season is divided into four trapping periods. You should select only one period at a time for the best result.
Colored dots in the map show trapping localities. Colors indicate the average number of beetles caught at each trapping locality (see "Tegnforklaring" at the top of the menu). If you click on a dot, a box appears showing:
- The number of Ips typographus individuals per trap and trapping period.
- Date when the first and second beetle generation is estimated to have been completed (or the % completed generation as of today's date if development is not yet finished). Note that the date given applies to the first beetles of each generation and that development of beetles can spread over several weeks.
- A time series of trap catches from the start of the bark beetle monitoring in 1979 until today. The time series shows average yearly trap catches for the whole county where the trapping locality is situated. The horizontal dashed line indicates a provisional outbreak level (= trap catches in the hardest hit counties at the end of the last bark beetle outbreak in the 1970s). The box can be stretched to see the time series more clearly.
Contacts

Paal Krokene
Research Professor
-
Division of Biotechnology and Plant Health
(+47) 995 16 013 paal.krokene@nibio.no Office Location: Ås H8
Links
To map layers in KildenContacts
Paal Krokene
Research Professor
-
Division of Biotechnology and Plant Health
(+47) 995 16 013 paal.krokene@nibio.no Office Location: Ås H8