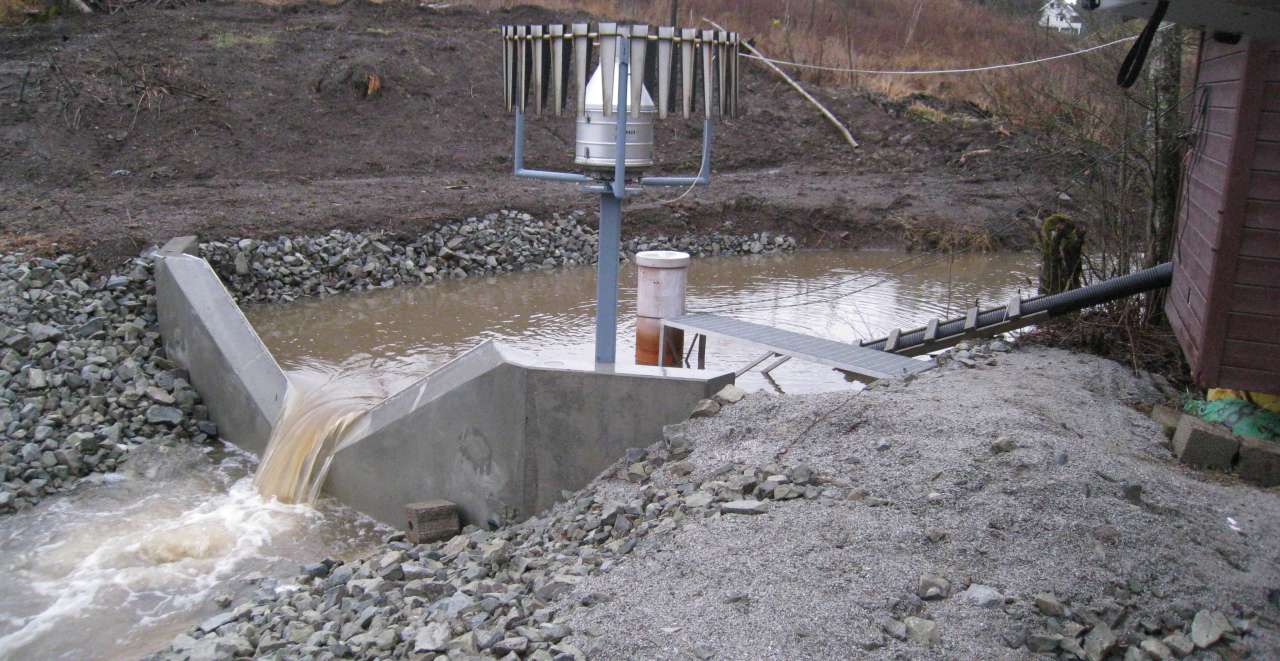
Water flow measurements
Most of the monitoring stations are instrumented for continuous measurement of water flow and flow-proportional water sampling. The stations have either installed Crump-weir or V-notch weir. Water height in the weir is measured continuously with a pressure sensor. Water flow is calculated automatically using a data logger, based on the measured water level and a water flow equation for each measurement profile. Sampling is hence proportional to water flow.
Data for water flow, air temperature, water temperature and conductivity are transmitted daily via telephone and modem to NIBIO.
Water sampling proportional to water flow
When a certain amount of water has passed through the monitoring station, the sampler automatically sucks a water sample. The amount varies between stations, but lies between 5 and 100 ml. These samples are mixed and collected in a container which is kept in a refrigerator. From the container we get a mixed sample for lab analysis that is representative for the water flow in the actual period. Mixed samples are normally taken every 14 days and sent for analysis of nutrients, particles and pesticides (only during the growing season).
Random and special water sampling
At the stations without automatic sampling equipment, the samples are taken manually by filling a flask directly from the river. The results from this grab sampling shows the situation on the time of sampling and thus are not representative of a longer period as are the mixed samples. This is normally done only in the Lier and Hobøl rivers, but can occur at other stations if the automatic sampler is out of order and during extreme weather conditions with an expected high risk of nutrient and pesticide leaching.