Satellite data may help farmers cope with too little or too much water
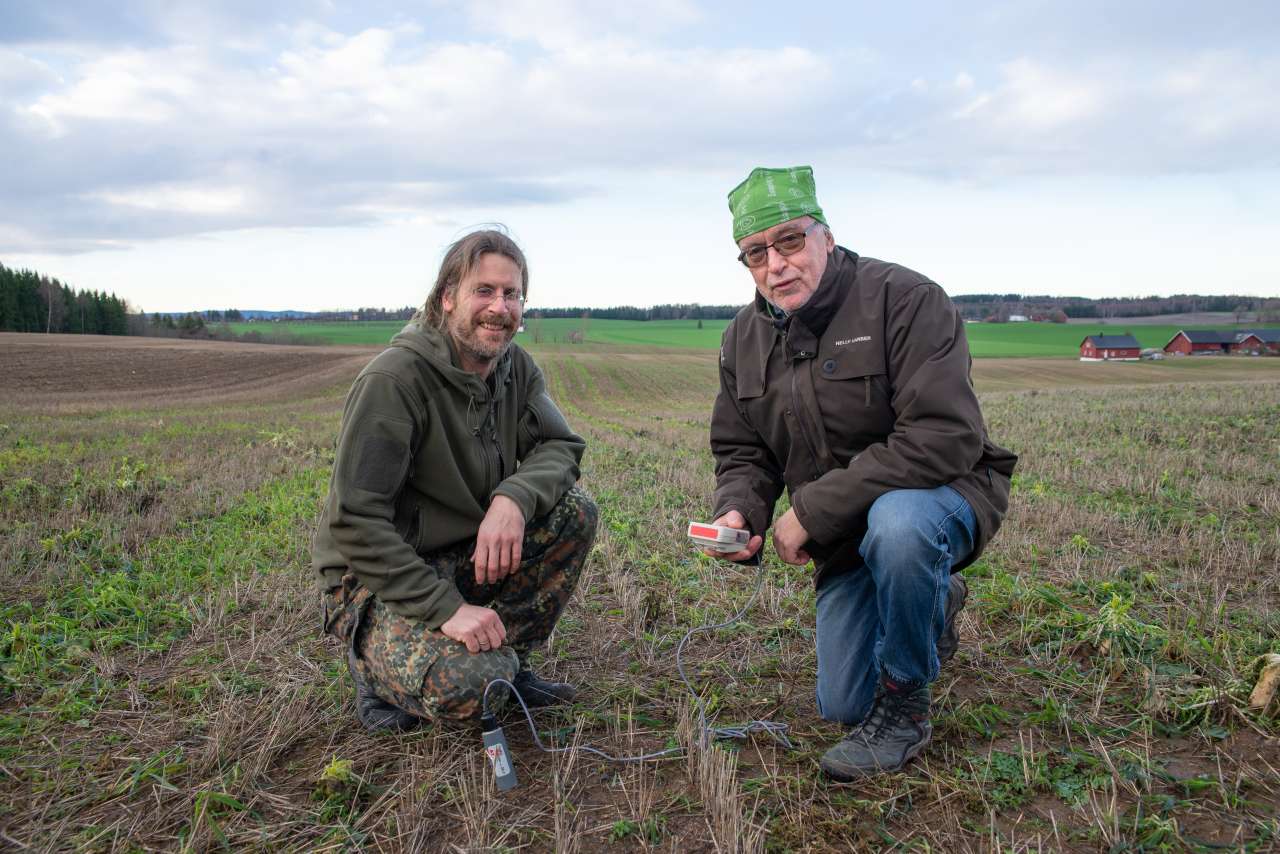
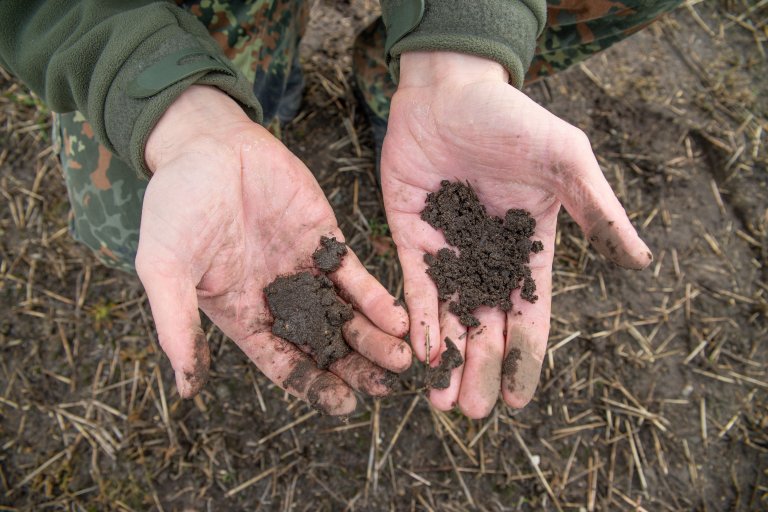
Research Scientist Robert Barneveld and Senior Research Scientist Johannes Deelstra in the field, measuring soil moisture content. Photo: Anette Tjomsland.
How much water does the soil contain? Whether it is too much or too little, it is crucial for farmers to know. Real soil moisture measurement, combined with information obtained using drones and satellite images may provide some answers.
When a raindrop hits the soil surface, its fate is all but certain. While some of the precipitation infiltrates into the soil, the remainder will stay above ground and generate puddles and surface runoff. Plants will absorb some of the water, but not all. The rest will either infiltrate into the groundwater, or end up in a tile drain. Combining the efforts of Spanish, Italian, Romanian and Norwegian scientists, the IRIDA project aims to find out how much of a raindrop that ends up in each of these destinations.
- Due to water scarcity, farmers in southern Europe need to improve irrigation plans for agricultural crops. Here in Norway, we usually have too much water, so for us the question is how do we handle all the water? Says Johannes Deelstra, Senior Research Scientist at NIBIO. He is project leader for the Norwegian research team in the joint European research project.
- Norwegian farmers have trouble with runoff, erosion, and loss of phosphorus and nitrogen. We try to answer questions such as; when is the right time for the farmer to drive into the field to carry out a tillage operation or harvesting a crop? If the ground becomes too wet, the weight of the heavy tractor will pack the soil and damage its qualities.

Photo and illustration: Robert Barneveld.
Combining satellite measurements with drone and on the ground measurements
In the project, the researchers use satellite data to estimate evapotranspiration, soil moisture content and plant growth. A drone collects data about the spatial distribution of crop growth and soil moisture content at an intermediary level. The collected data from satellites and drones are compared with on ground measurements of plant growth and soil moisture content.
- The use of drones and on the ground measurements of crop growth and soil moisture content is like zooming into one pixel on the satellite photos. There is a lot that happens at the very small scale, says Robert Barneveld. He is Research Scientist in NIBIO, drone pilot, and in charge of satellite data in the project.
Satellites pass over every third day, but in reality, there is often more time in between satellite images because of cloud coverage.
- The main goal will be that soil moisture content obtained from simulation models in the future can be adjusted by real time information obtained from satellites. From a modelling point of view, this means that we can select catchments for which our pilot watershed is representative, and give information about soil water balance, and runoff estimates for non-monitored catchments, explains senior Research Scientist, Csilla Farkas from NIBIO. She is in charge of modelling in the project.
Video filmed with drone above the trial area in Norway. Film: Robert Barneveld.
Norwegian conditions: Large variations in soils over short distances
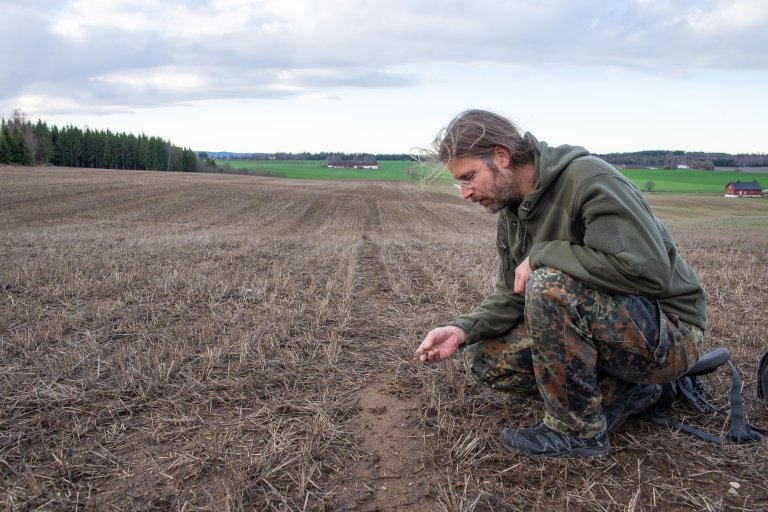
In Norway, the main activities are carried out in a small field scale catchment close to Ås, approximately 30 minutes south of Oslo. It includes both forest and agricultural land. The soil in the trial area are dominated by marine silt loam and silty clay loam.
- Campaign measurements have shown that large variations in soil moisture content can exists over short distances. This issue raises special challenges in providing the right information to the potential users through a Decision Support system, says Barneveld.
He is talking about the ultimate aim of the project, which is to develop an online tool that gives the status and prediction of soil moisture content at a local scale. They call it Decision Support system (DSS).
- These challenges are most likely not prevailing that much in estimating soil moisture content for our southern European partners. This is mainly because there is an almost year-round water deficit. Often there is less variation in soil moisture content when soils are dryer, explains Deelstra.

Water advices to the farmer
The DSS combine static data, like soil type, with dynamic data sources such as satellite imagery, weather history and outputs from soil moisture models upon the request of a user.
- The DSS will give estimates of soil water content status for the nearest period, and give advice on for example when the soil becomes trafficable, or when farmers should plan irrigation, says Farkas.
In Spain, the DSS already has a functional version. There, farmers can enter the coordinates of their field, and what kind of crop they are cultivating. The online tool then calculates the water used by the plants, and provides a precise recommendation on how much to irrigate.
However, Deelstra emphasis that a fully functional DSS is not feasible in Norway, within the current project.
- This project aims at developing a prototype for the trial area in Norway.
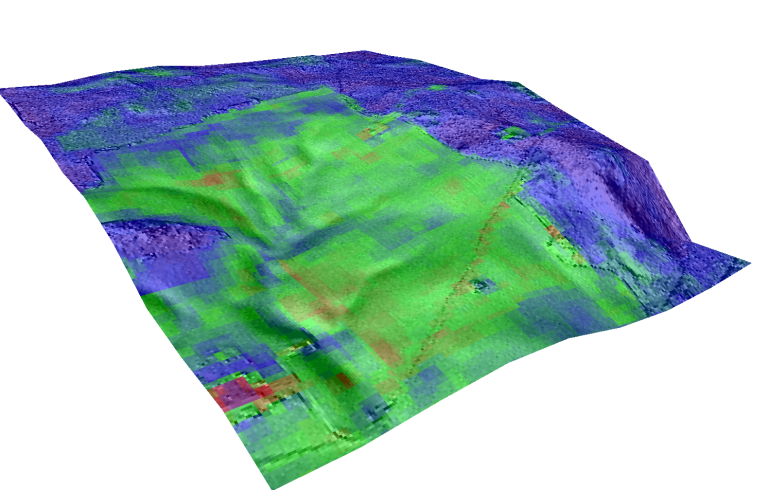
Combined 3D elevation model and drone image of plant cover. Both from drone imagery. Photo and illustration: Robert Barneveld.
Contacts

Johannes Deelstra
Research Professor (OAP Agreement)
-
Division of Environment and Natural Resources
(+47) 926 99 501 johannes.deelstra@nibio.no Office Location: Ås O43
IRIDA
IRIDA stands for: Innovative remote and ground sensors, data and tools into a decision support system for agriculture water management. IRIDA´s approach is to combine on the ground evapotranspiration (ET) and soil moisture measurements, with remote sensing of ET, obtained with unmanned aerial vehicle (UAV/RPAS/UAS) (at plot scale), and manned vehicles and satellites (at catchment scale). IRIDA will integrate the methodologies and routines into a decision support system that will serve to manage the large amount of inputs by means of big data analyses tools, and the outputs of the PERSiST and DrainMod mathematical models. The research may lead to better prediction of floods ahead, sustainable soil tillage operations and improved irrigation practices.
IRIDA received funding from the EU and national funding organisations. The Research Council of Norway finances IRIDA in Norway.
International partners:
CEBAS-CSIC
IAS-CSIC
Innovati
University of Catania
CREA-ACM
NMA
NIBIO
Links
IRIDA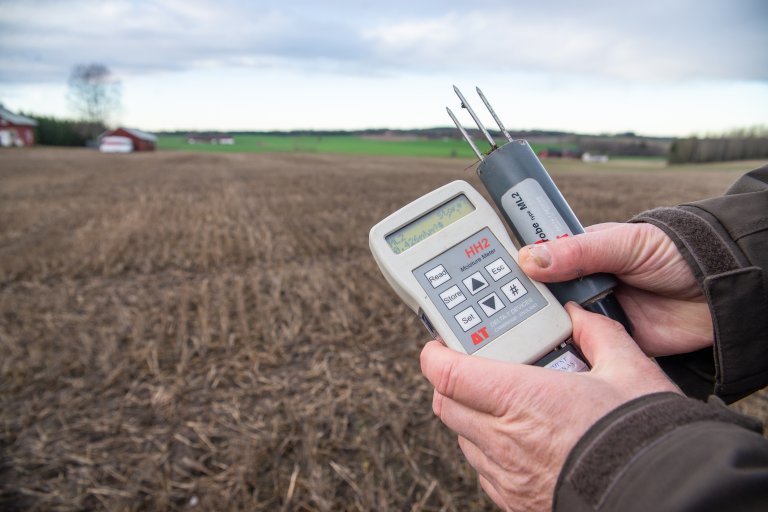
Contacts
Johannes Deelstra
Research Professor (OAP Agreement)
-
Division of Environment and Natural Resources
(+47) 926 99 501 johannes.deelstra@nibio.no Office Location: Ås O43