Nine facts about Norwegian agriculture
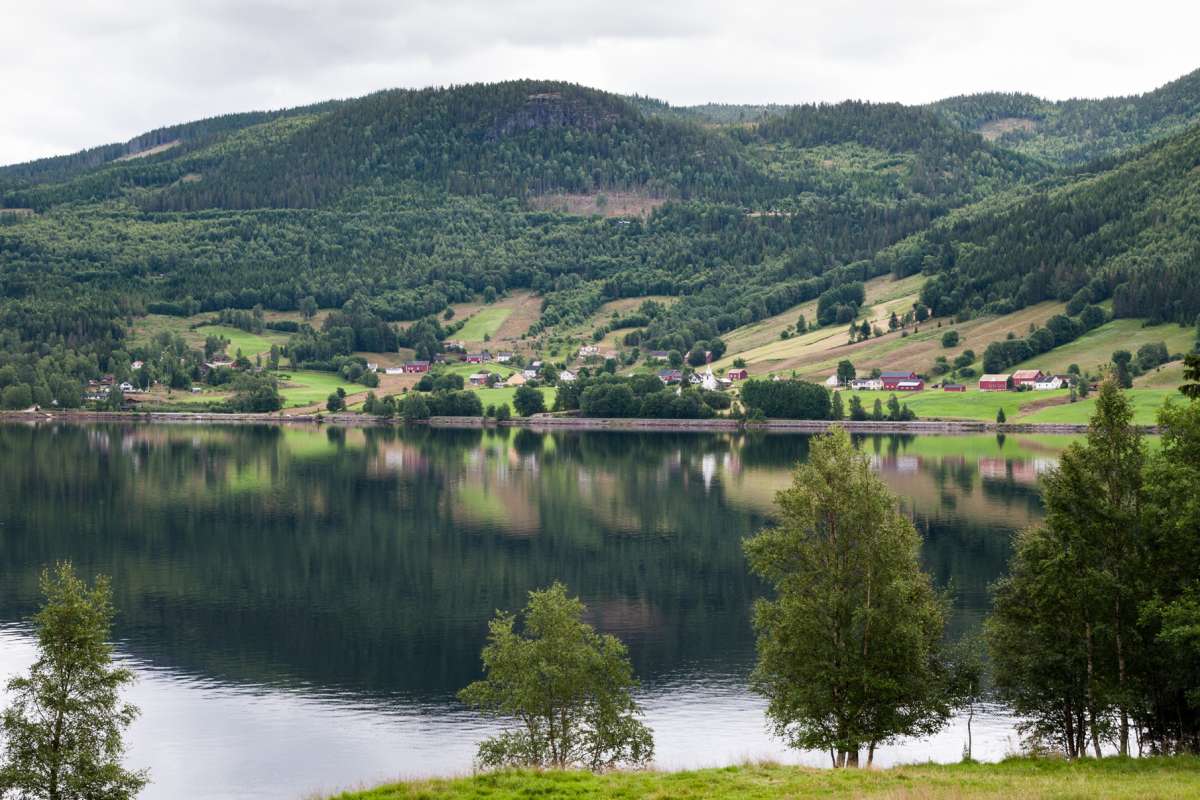
Agricultural landscape in Nordre Follo municipality, in the south-eastern part of Norway. Photo: Morten Günther
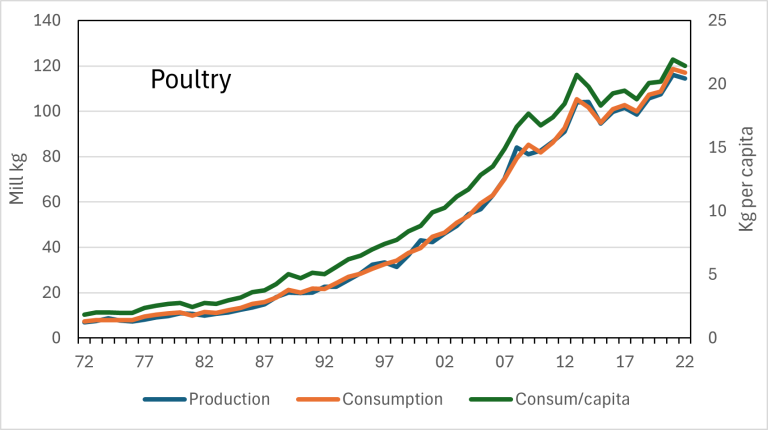
Norway's agricultural landscape is undergoing a remarkable transformation. While milk consumption has halved over the past three decades, cheese and poultry have surged in popularity. Today, the average Norwegian consumes 19 kg of cheese and 20 kg of poultry annually - a staggering increase of 5 kg and 14 kg respectively since 1995.
These shifting dietary patterns reflect broader changes in Norwegian agriculture and food culture. From the lush grasslands of the west to the fertile plains of the southeast, farmers are adapting to new consumer demands, technological advancements, and environmental challenges.
The story of Norwegian agriculture is one of resilience and innovation. Despite having only 3% of its land suitable for farming, Norway has managed to maintain a high degree of food self-sufficiency. This achievement is even more impressive considering the country's northern location, with some parts lying within the Arctic Circle.
As we delve into the facts and figures of Norwegian agriculture, we'll uncover a sector that's not just about food production, but also about preserving cultural heritage, managing landscapes, and contributing to rural economies. From the traditional dairy farms of the fjords to the high-tech greenhouses near urban centers, Norwegian agriculture is a vital part of the nation's past, present, and future.
Join us as we explore nine key facts that illuminate the current state and future trends of agriculture in this unique Nordic nation.
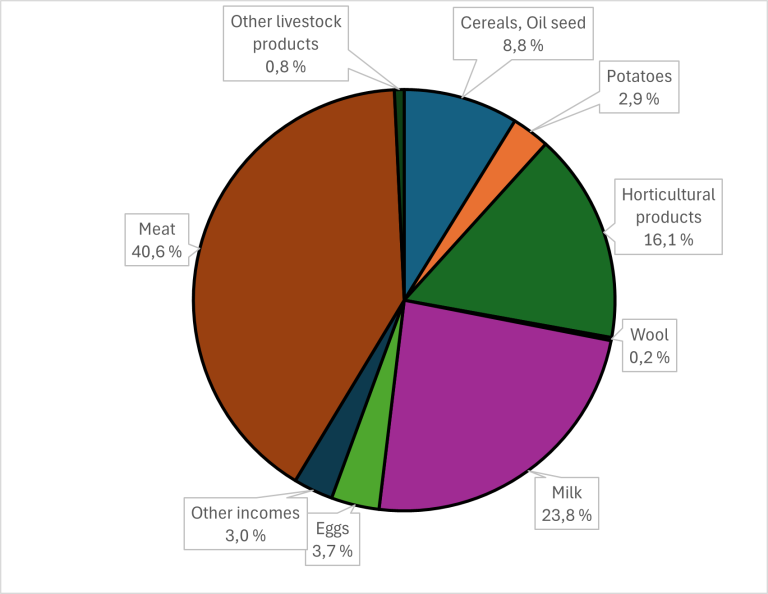
As an introduction, it may be useful to look at the distribution of Norwegian agriculture’s total gross output between various farm commodities. The total gross output as normalized earnings for 2023 were NOK 41,6 billion, excluding direct subsidies:
Status presented through nine facts
1 – Agricultural Economy and Food Security in Norway
The number of agricultural holdings has declined from 99,400 in 1989 to around 37,000 in 2023. The total gross output of Norwegian agriculture was NOK 59.5 billion in 2023, including all subsidies. Sales of milk and meat are the two largest sources of income, with milk accounting for 26.8% and meat for 35.6% of total agricultural output.
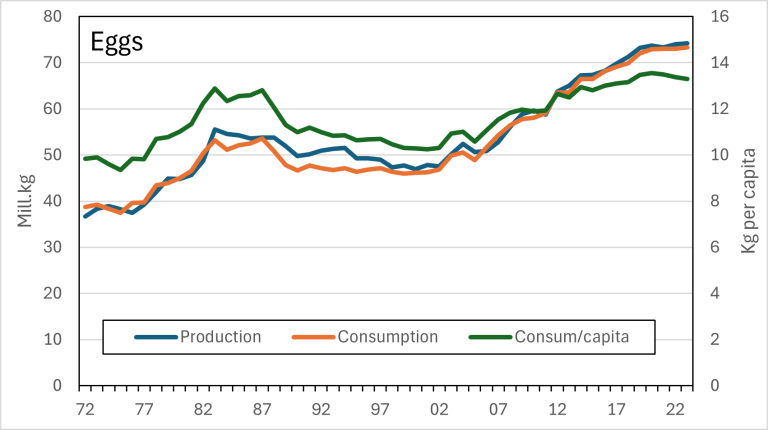
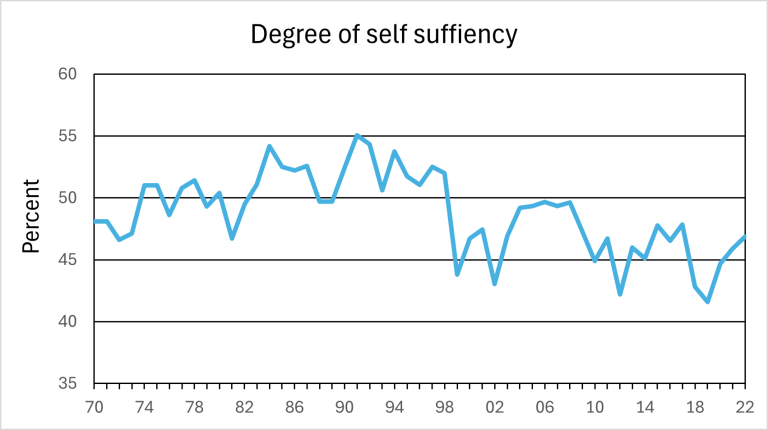
Norway's food self-sufficiency rate has fluctuated between 45-55% since 1970. This rate drops below 45% in years with poor grain yields, as witnessed in 2012 and 2018. While Norway relies heavily on imports for fruits and berries, the country maintains high self-sufficiency in dairy products, eggs, and meat.
2 – Farm sizes are expanding
In 1999 the average farm size was 14.8 ha. Twenty-five years later, in 2024 this average was 26.1 ha.
The average farmland acreage on farms still in operation is steadily increasing.
3 – Rented land is important
In 2024 approximately 48 percent of total farmland acreage was rented land.
The share of rented land of the total farmland in operation has been steadily increasing since World War II. Larger farm holdings are part of the explanation, i.e. more expansive areas for production are needed than the farm naturally holds.
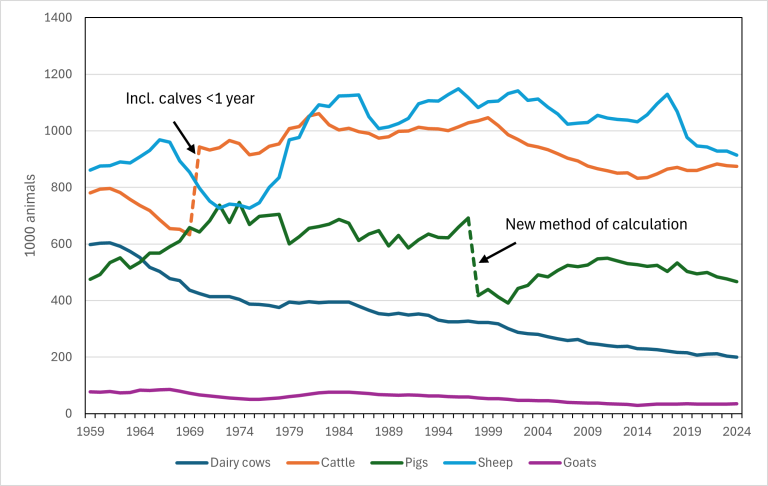
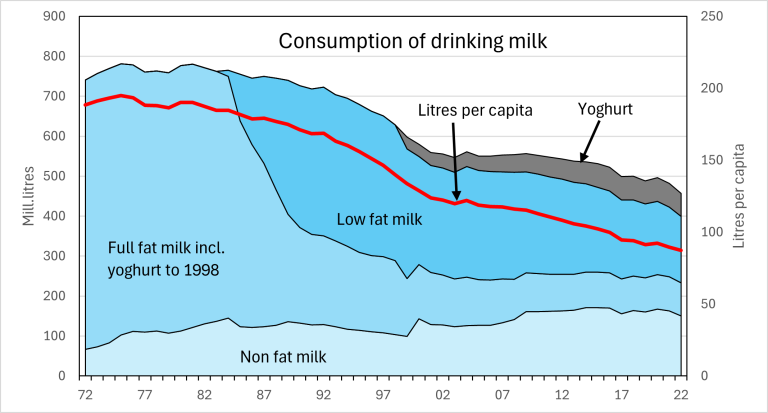
4 – Reduced consumption of milk
From 1980 to 2024, Norway’s dairy cow population has declined from 375,750 to 203,000.
This development is linked to declining milk consumption and thus total production. Since 2000, milk yields per cow have been increasing, whereas the total milk production in the same period has been fairly stable, with an annual output of approx. 1,500 million litres.
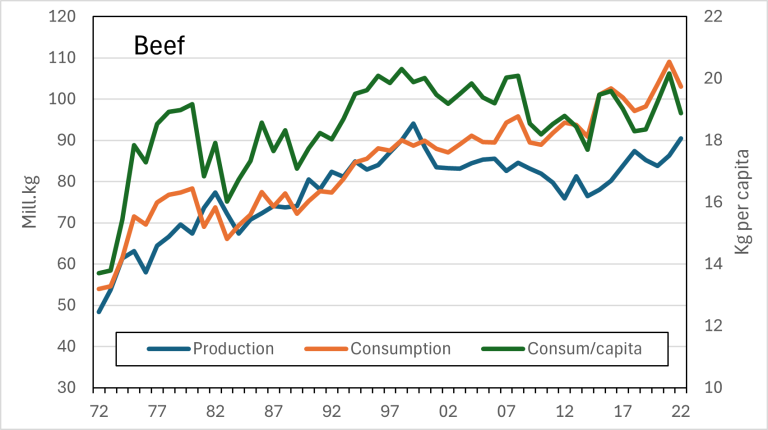
5 – Consumption of meat has doubled in 40 years
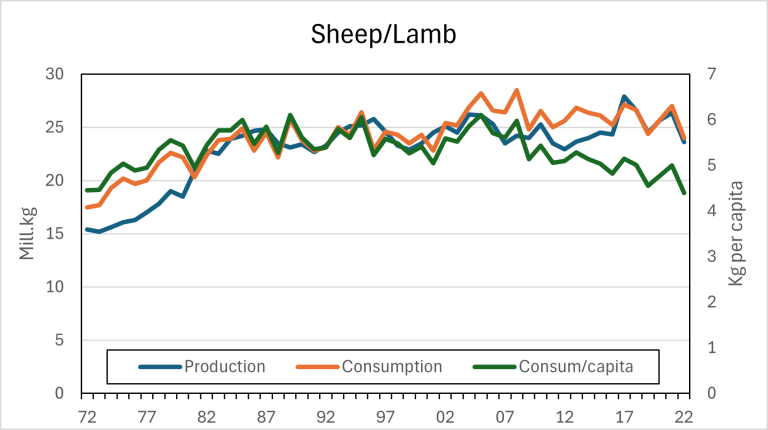
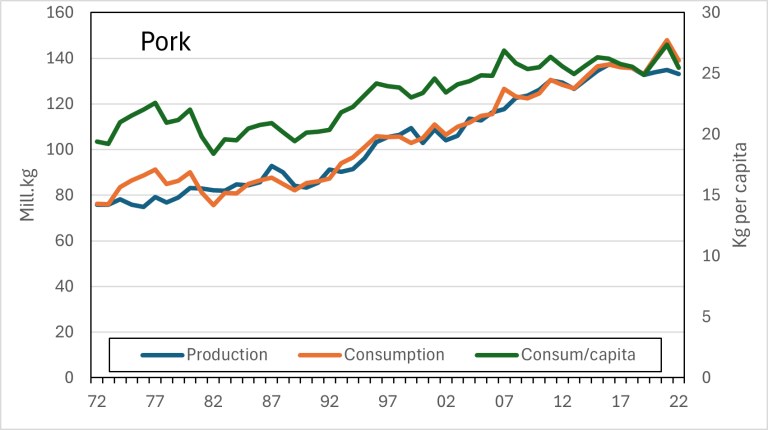
The annal consumption of beef, veal, lamb, mutton, pork and poultry was at an all-time high in 2021 at about 407,000 tons in total. This is about twice the amount consumed in the early 1980s, although the increase per capita is somewhat lower. Pork has the highest consumption - 25.5 kg per capita.
There has been some import of meat, especially beef. This is due to the declining cattle population as a result of reduced milk consumption and production.
The production and consumption of meat in Norway has been steadily increasing for the past 30-40 years, especially due to an increase in poultry meat consumption. Consumption of poultry peaked in 2013, and again in 2023. Consumption is highest for pork, at 23.6 kg per capita. The focus on nutrition and food safety issues can potentially cause considerable variations in meat demand. For example, publicity about the use of antibiotics (Narasin) in poultry feed led to a sharp decline in chicken consumption in 2014 and 2015.
6 - Lamb/sheep = weak economy
Norway’s sheep population increased by 9 percent from 2014 to 2017, following measures to stimulate production.
This resulted in overproduction, reduced profitability and a decline of the sheep population by 18 percent in the years after 2017. Many smaller sheep farms have gone out of business in connection with farm succession.
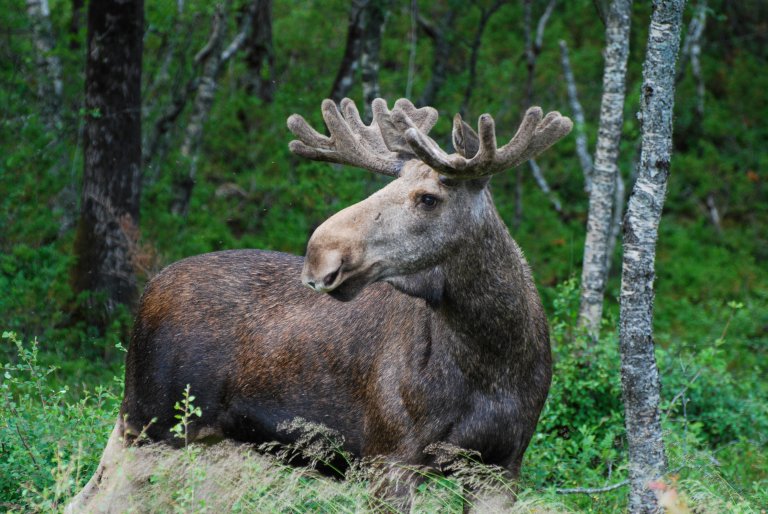
7 – Big game resources
Game hunting is a good source of income for owners of forests and other non-cultivated areas. In the 2023/2024 hunting season, 26,003 elks, 52,503 red deer and 3,493 wild reindeer were felled.
The estimated total slaughter weights for big game animals felled in the 2023/2024 hunting season were 3,172 metric tons elk meat, 2,455 metric tons red deer meat and 126 metric tons reindeer meat. At an estimated first-hand price of NOK 100 per kg, this represents a total value of nearly NOK 575.3 million.
8 – Organic paradox
The total area under organic farming has decreased by 13 percent since 2013. The organic area increased somewhat from 2019 to 2020 but continued to decrease again after 2020.
As of 2023, about 41,100 ha were farmed organically, equivalent to 4.2 percent of Norway’s total farmland.
However, the sales value of organic foods in the food retail trade has increased steadily since 2010, with a slight decrease in recent years. Total sales of organic food amounted to a value of NOK 2.5 billion in 2023. Due to price increases, it is not possible to know for sure whether increased value in sales is due to increased consumption or increased prices.
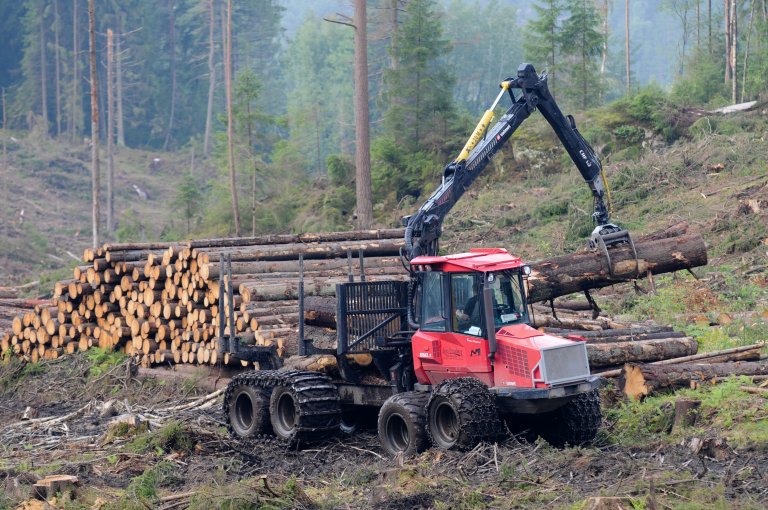
9 – Norway's Forest Landscape: A Vital Economic and Environmental Resource
Norway's forests cover an impressive 39% of the country's total land area, spanning 12.7 million hectares. This vast expanse includes both productive and non-productive forests, with 8.3 million hectares (25% of Norway's land area) classified as productive forest land.
The forest ownership structure in Norway is predominantly private, with 96% of the 126,125 forest estates under individual ownership. In 2022, the average productive forest area per estate was approximately 55 hectares.
Norwegian forestry has evolved into a significant source of capital income for forest owners, with modern harvesting methods dominating the industry. About 90% of timber volume is harvested using advanced logging machines. Interestingly, 30,068 forest estates combine forestry operations with agricultural activities, showcasing the diverse nature of rural livelihoods in Norway.
Beyond their economic value, Norwegian forests play a crucial role in climate regulation. In 2022, these forests demonstrated their environmental significance by absorbing a net 17.9 million tons of CO2, offsetting roughly 38% of Norway's total greenhouse gas emissions. This underscores the vital contribution of sustainable forest management to both the timber industry and global climate mitigation efforts.The dual benefits of Norwegian forests are clear:
- They provide a renewable resource for timber production and economic growth.
- They act as a substantial carbon sink, supporting Norway's commitment to reducing its carbon footprint.
By promoting sustainable forestry practices, Norway continues to balance economic interests with environmental stewardship, ensuring that its forests remain a valuable asset for generations to come.
Agriculture in Norway
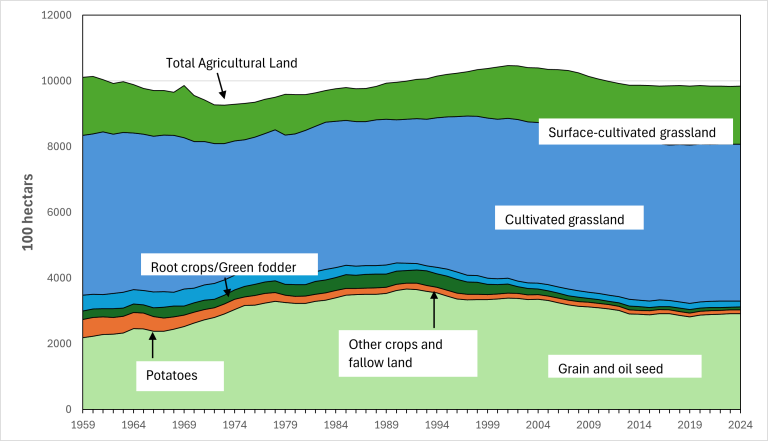
Topography, geology, and biology form the foundation for plant production, while climate and geography determine the types of crops that can be grown in specific areas, as well as the expected yields.
"Norway has a marginal production area for many important crops and is one of the few European countries that cannot grow sugar crops," explains agricultural economist Heidi Knutsen.
When discussing Norwegian agriculture, it is important to consider the country’s northern location. Some parts of Norway are in the Arctic, which makes agriculture a challenging endeavour. Heidi Knutsen continues:
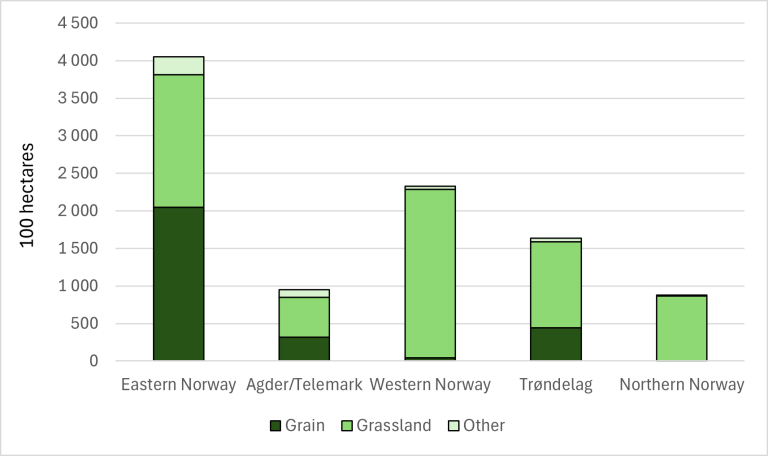
"Due to Norway’s climate, grain yields per hectare are lower than in most other European countries. In many parts of the country, growing fodder crops, mainly grass, is essentially the only viable option."
Grass-based livestock production is therefore the backbone of Norwegian agriculture. A significant portion of the country’s home-grown grain is used as fodder due to crop quality.
One of the advantages of the cool climate is that it helps limit the spread of plant diseases and pests.
These climatic and geographical conditions shape Norwegian agriculture. Soil, latitude, and climate are all interconnected.
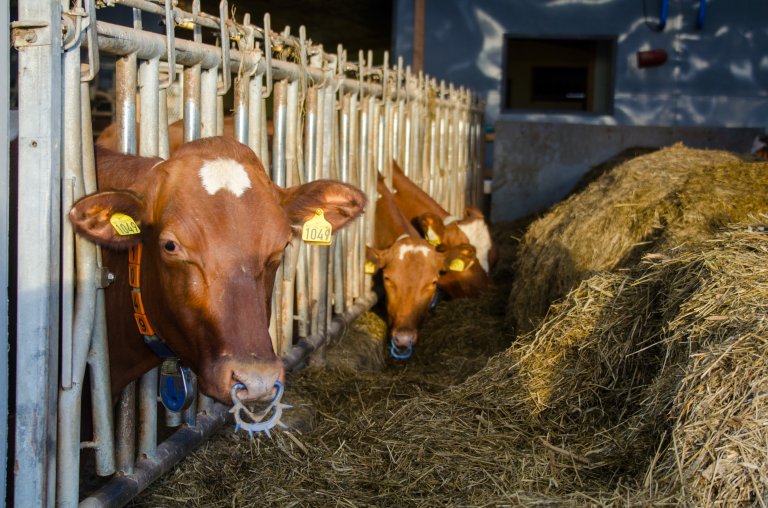
Dairy production – of core economic value
In a country where growing fodder crops like grass is often the only viable option, grass-based livestock production forms the backbone of Norwegian agriculture. This explains why the dairy cow has become the most important agricultural production. The dairy cow provides milk, meat, and, together with grazing sheep, helps maintain the Norwegian agricultural landscape as we know it.
However, times are changing for both the dairy cow and the dairy farmer. Milk yields per cow have never been higher, but so has the competition. The import of cheese and other dairy products is at an all-time high, and the trend of reducing meat consumption is gaining traction among consumers.
The Norwegian dairy cow will likely have to adapt to these changing times—just like everything else. Issues such as reducing greenhouse gas emissions, finding alternative fodder to reduce soy imports, and maximizing the use of Norway’s own grass resources are just some of the challenges that have recently emerged.
«Efficient by nature»
As previously mentioned, Norway is not naturally suited for agriculture. Nevertheless, farming productivity has steadily increased in relation to the resources used.
Even within the same agricultural areas and with fewer man-hours, production volumes have either increased or remained stable, indicating improved efficiency. Various forms of capital now substitute labour.
Contacts

Heidi Knutsen
Senior Adviser
-
Division of Survey and Statistics
(+47) 472 77 017 heidi.knutsen@nibio.no Office Location: Bergen
FACTS ABOUT NORWEGIAN AGRICULTURE
Only 3 percent of Norway’s total land area (excluding Svalbard and Jan Mayen) is farmed land. Of the 3 percent in agricultural use, only a smaller part is in areas where climatic conditions are suitable for growing cereals for human consumption.
39 percent of the land area in Norway is covered by forests.
By comparison, industrial and built-up areas account for 0.5 percent of the total land area.
According to The Budget Committee for Agriculture, the total agricultural area in Norway was 0.984 million ha in 2018, of which approx. 0.807 million ha was arable land. Between 2001 and 2023, the total agricultural area in Norway decreased by 6 percent.
THE «NORWEGIAN MODEL»: THE BASIC AGRICULTURAL AGREEMENT AND ANNUAL AGRICULTURAL NEGOTIATIONS
• The Basic Agricultural Agreement provides the mandate for the annual negotiations and specifies the scope and the parties of the negotiations
• The Budget Committee for Agriculture prepares the parties’ joint background material for the negotiations (ca. 10th of April)
• Demands put forth by the farmers’ associations (late April)
• Offer made by the Government (early May)
• Negotiations
• Agreement (or breach of negotiations) before ca. 15th of May
• The Storting (Parliament) approves the agreement in June
Contacts
Heidi Knutsen
Senior Adviser
-
Division of Survey and Statistics
(+47) 472 77 017 heidi.knutsen@nibio.no Office Location: Bergen
Publications
Abstract
No abstract has been registered